Material flow
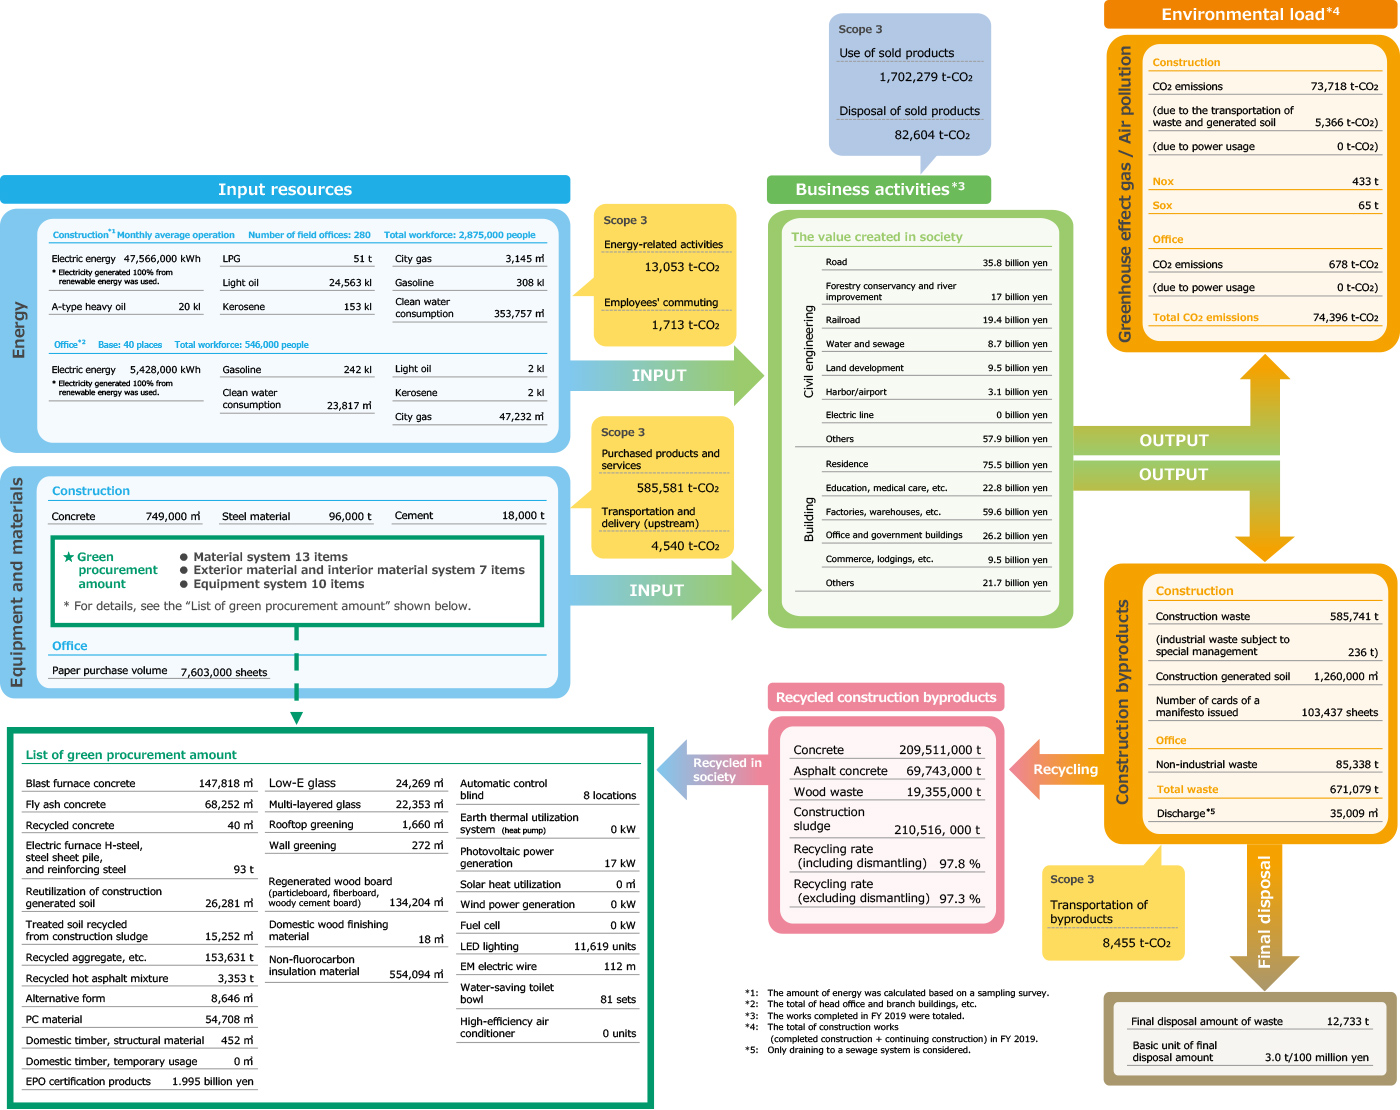
The material flow of our company in FY 2022 is reported here. To provide society with value through our business activities, we have inputted the following resources. On top of that, target values are set and activities are underway to reduce the environmental load generated (KPI). Further, Scope 1 emissions from MAEDA CORPORATION’s construction work are calculated while including CO2 emissions from fuels consumed by our subcontractors and those from the transportation of soil generated from construction and construction byproducts, in accordance with the aggregation method of the Japan Federation of Construction Contractors.

Energy usage
* You can check the whole by scrolling horizontally.
| 2020 | 2021 | 2022 | ||
|---|---|---|---|---|
| Construction | Electric energy | 30,002,000 kWh (95,000 kWh) |
27,890,000 kWh (106,000 kWh) |
47,566,000 kWh (47,566,000 kWh) |
| A-type heavy oil | 1 kl | 27 kl | 20 kl | |
| LPG | 73 t | 34 t | 51 t | |
| Light oil | 18,455 kl | 23,416 kl | 24,563 kl | |
| Kerosene | 275 kl | 191 kl | 153 kl | |
| City gas | 24,861 m3 | 81,563 m3 | 3,145 m3 | |
| Gasoline | 367 kl | 323 kl | 308 kl | |
| Clean water consumption | 707,219 m3 | 384,526 m3 | 353,757 m3 | |
| Office | Electric energy | 3,977,000 kWh (515,000 kWh) |
5,119,000 kWh (3,707,000 kWh) |
5,428,000 kWh (5,428,000 kWh) |
| Gasoline | 158 kl | 247 kl | 242 kl | |
| Clean water consumption | 15,182 m3 | 13,649 m3 | 23,817 m3 | |
| Light oil | 4 kl | 2 kl | 2 kl | |
| Kerosene | 3 kl | 2 kl | 2 kl | |
| City gas | 13,787 m3 | 12,409 m3 | 47,232 m3 |
Equipment usage*
* You can check the whole by scrolling horizontally.
| 2020 | 2021 | 2022 | ||
|---|---|---|---|---|
| Construction | Concrete | 516,000 m3 | 549,000 m3 | 749,000 m3 |
| Steel material | 312,000 t | 233,000 t | 96,000 t | |
| Cement | 24,000 t | 39,000 t | 18,000 t | |
| Office | Paper purchase volume | 8,235,000 sheets | 8,236,000 sheets | 7,603,000 sheets |
- *Refer to the data book “Green procurement amount list” for the green procurement amount.